How to Optimize Conversion Across Your Entire SaaS Funnel
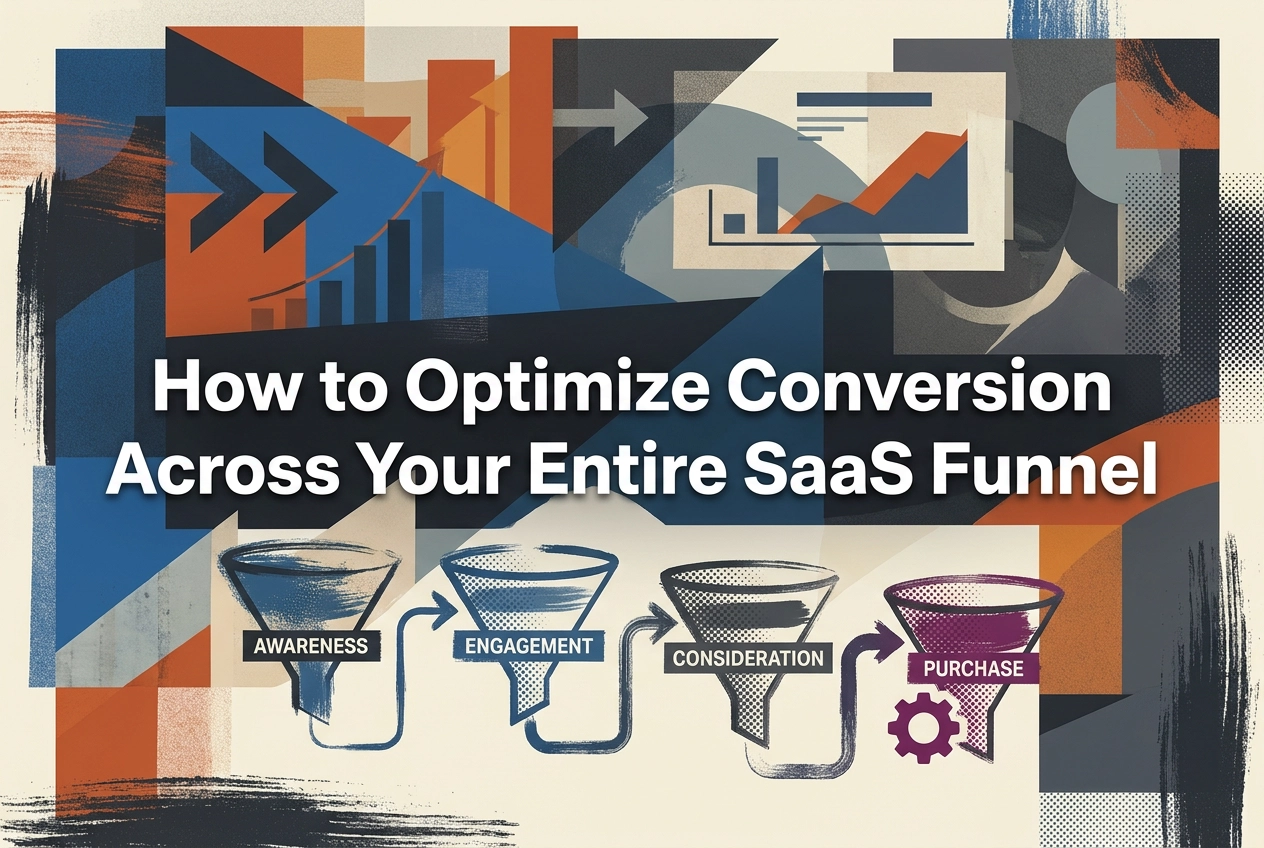
Most SaaS companies are leaving serious revenue on the table, not because they lack traffic or a solid product, but because they treat conversion as a single event rather than a continuous process. A visitor signs up, a trial user explores features, a paying customer renews or churns. Each of these moments represents a critical opportunity that many teams either overlook or underestimate.
To truly optimize conversion across your SaaS funnel, you need to move beyond isolated tactics and start thinking systematically. That means analyzing every stage, from first touch to long-term retention, and understanding how friction, messaging, and user behavior interact at each point.
In this analysis, we will break down the key levers that drive conversion at the top, middle, and bottom of the funnel. You will learn how to identify where prospects are dropping off, which optimization strategies have the highest impact, and how to build a feedback loop that continuously improves performance over time. If you are ready to stop guessing and start making data-driven decisions, this guide will give you the framework to do exactly that.
Why the 'Drive More Traffic' Playbook Is Broken
For years, the default growth lever in SaaS has been deceptively simple: when revenue slows, buy more traffic. Run more ads, increase the budget, watch pipeline grow. In 2026, that playbook is not just ineffective; it is actively destructive to unit economics.
The data is unambiguous. The median SaaS CAC ratio rose 14% in 2024, meaning the typical company now spends $2.00 to acquire every $1.00 of new ARR. In the highest-spending quartile, that figure climbs to $2.82 per dollar of ARR generated. When your acquisition cost already exceeds the revenue it produces, scaling spend does not accelerate growth. It accelerates losses. Every additional dollar pushed into paid channels under these economics compounds the problem rather than solving it, and the math deteriorates faster than most growth teams realize until the CFO starts asking hard questions.
The CAC payback situation has become a board-level conversation, not a marketing KPI. According to OpenView SaaS Benchmarks, the median CAC payback period for companies in the $5M to $50M ARR range stretched to 18 months in 2026, up from 15 months in 2023. The broader B2B SaaS median sits at 16 months, per current CAC payback benchmarks from Aleph. Only top-quartile companies recover CAC in under six months. That gap represents a fundamental divergence in capital efficiency, and investors who once tolerated 18 to 24 month payback periods during the zero-interest-rate era have reset their expectations to a 12-month target. Teams that continue optimizing for traffic volume rather than conversion efficiency are operating on the wrong side of that expectation.
The metrics boards and CFOs track have shifted accordingly. MQL volume, impression counts, and cost-per-click have been retired as primary reporting layers. The metrics that now drive investment decisions are Net New ARR by channel, CAC payback period, pipeline velocity, MQL-to-SQL rate, and LTV:CAC. According to SaaS CAC benchmark analysis from Fatgraphs, the consensus floor for a healthy LTV:CAC ratio remains 3.0x; below that threshold, marketing investment compounds slower than capital costs. These are not vanity guardrails. They are signals that determine whether a growth program receives more funding or faces hard cuts.
The conversion math makes the alternative strategy impossible to ignore. A website converting at 2% visitor-to-lead, improved to 4%, produces the same ARR output as doubling ad spend, but at near-zero marginal cost. There is no incremental media buy, no higher CPCs, no worsening CAC ratio attached to that gain. Average B2B SaaS visitor-to-lead rates sit at just 1.5% to 2.5%, while top performers reach 8% to 15%. That gap does not represent a testing problem; it represents a measurement and prioritization problem.
The teams winning in 2026 have internalized a simple sequencing rule: optimize the funnel you already have before paying to fill it with more traffic. Conversion efficiency is no longer a marketing team initiative running in the background. It is a growth strategy with direct line-of-sight to the metrics that determine how a company is valued, funded, and scaled.
The Full Seven-Stage Funnel Benchmark Map
Knowing that the traffic-to-revenue playbook is broken is one thing. Knowing precisely where your funnel leaks is another. The seven-stage benchmark map below gives you the diagnostic baseline to identify which conversion gap is costing you the most ARR, and how far you are from top-quartile performance at each stage.
Stage 1: Visitor to Lead
The average B2B SaaS website converts just 1.5–2.5% of visitors into leads. The top 10% of companies reach 8–15%. To make that gap concrete: at 100,000 monthly visitors and a $10,000 ACV, moving from 1.5% to 8% conversion adds roughly 6,500 incremental leads per month into the top of your funnel. Even at modest downstream conversion rates, that delta compounds into millions of dollars in unrealized ARR annually. Most teams treat this as a traffic problem and respond by spending more on acquisition, when the actual problem is conversion infrastructure: landing page relevance, CTA specificity, and lead magnet alignment with genuine buyer intent.
Stage 2: Lead to MQL
Average lead-to-MQL conversion across B2B SaaS sits at 36%. Top-quartile teams achieve 45–60%, not by generating more leads, but by being more selective about which ones qualify. The lever here is tightening ICP definition and lead scoring criteria so that every MQL reflects a real buying signal rather than a completed form field. Teams that inflate MQL counts by passing through every submission create a false pipeline that corrupts SQL rates, distorts CAC calculations, and erodes sales trust in marketing-sourced leads over time.
Stage 3: MQL to SQL
This stage reveals the largest performance gap in the entire funnel. SMB-focused teams average 13–20% MQL-to-SQL conversion; enterprise teams average 10–15%, reflecting longer cycles and stricter qualification gates. Top-quartile performers in both segments reach 55–70%, and the differentiator is almost always alignment: marketing qualification criteria mapped directly to sales acceptance criteria, formalized in a documented SLA. When marketing and sales define "qualified" differently, leads fall into a gap where neither team owns the outcome.
Stage 4: Free Trial to Paid (Self-Serve vs. PQL Motion)
Self-serve motions average just 4.6% trial-to-paid conversion. Sales-assisted Product Qualified Lead (PQL) motions average 17.4%, nearly four times higher. A PQL is a trial user whose in-product behavior signals readiness to buy: they have hit a usage threshold, activated a key feature, or reached a natural expansion point. When a human touchpoint meets that signal at the right moment, conversion rates reflect it decisively. Teams that rely entirely on self-serve without building PQL triggers leave the majority of their trial cohort to churn passively rather than convert actively.
Stage 5: Trial Structure as a Conversion Variable
Credit-card-required trials convert at 40–60%. No-card trials convert at rates far closer to the 4.6% self-serve average. The mechanism is straightforward: requiring a card at signup pre-qualifies intent rather than assuming it. The trade-off is real; card-required trials attract fewer signups at the top of the funnel. But the downstream cohort quality improves sharply enough that most SaaS teams with a clear ICP and a well-structured onboarding flow find the conversion math strongly favors the higher-friction entry point.
Stage 6 and 7: SQL to Closed-Won and Paid to Expansion
SQL-to-closed-won averages 20–30% for most B2B SaaS teams, with top performers reaching 40–50% through disciplined qualification earlier in the funnel. Expansion conversion is now a mandatory optimization surface, not an upsell afterthought. With 51% of public SaaS companies carrying a usage-based pricing component in 2026, up from just 27% in 2021, the funnel does not end at "paid." Expansion revenue driven by product usage signals, CSM-assisted upgrades, and seat growth represents a seventh stage with its own conversion criteria, success triggers, and measurement requirements.
Seven-Stage Benchmark Reference Table
Funnel Stage | Industry Average | Top Quartile | PLG / Self-Serve | Sales-Led |
|---|---|---|---|---|
Visitor to Lead | 1.5–2.5% | 8–15% | ~2% | ~3–4% |
Lead to MQL | 36% | 45–60% | Lower (volume play) | Higher (ICP-filtered) |
MQL to SQL | 13–20% (SMB); 10–15% (Ent.) | 55–70% | Not primary | Primary motion |
Trial to Paid (no card) | ~4.6% | ~10–15% | Primary motion | PQL-augmented |
Trial to Paid (card required) | 40–60% | Higher | Primary motion | Not applicable |
SQL to Closed-Won | 20–30% | 40–50% | Lower in self-serve | Higher with AE assist |
Paid to Expansion | Variable | Tracked separately | Product-signal driven | CSM and sales driven |
Use this table as your instant diagnostic. Identify the one stage where your current rate falls furthest below top-quartile, and that is almost always your highest-leverage optimization target before any additional spend is justified.
The Diagnostic Framework: Finding Your Leaking Stage
With the benchmark map in hand, the next step is applying a structured diagnostic lens to your own funnel data. Benchmarks tell you what good looks like; the diagnostic framework tells you where to look first and why.
The Weakest Stage Principle
A funnel operates as a chain, and its output is determined by its weakest link, not its strongest. Consider a team achieving a 10% visitor-to-lead rate, which sits comfortably above the B2B SaaS average of 1.5 to 2.5%. On the surface, top-of-funnel looks healthy. But if that same team's MQL-to-SQL rate is sitting at 5%, well below the SMB benchmark range of 13 to 20%, the funnel has a mid-funnel quality problem. The leads are coming in, but they are not the right leads, or the qualification process is failing to identify genuine buying intent. Pouring more budget into traffic acquisition will not resolve this. It will generate more volume at the top while the same qualification failure rejects the majority of it downstream, at increasing cost per lead.
This failure pattern is more common than most teams admit. According to research on conversion funnel analysis, mature funnels typically have one or two leaky steps that account for 60 to 80% of total drop-off, and fixing those specific transitions can improve completion rates by 20 to 40% without adding features or increasing spend. The problem is that most teams cannot name the exact step where the funnel breaks, because their reporting was not built to show them.
Attribution Is Where the Diagnosis Usually Fails
The most common reason teams optimize the wrong funnel stage is a broken or absent attribution model. When multi-touch attribution is missing, marketing platforms default to last-click credit, assigning conversion value to the final touchpoint before a lead converts. This creates a structurally distorted view of what is actually driving pipeline.
The downstream consequence is a predictable misallocation. A team reviews its attribution report, sees branded paid search generating conversions at volume, and doubles budget in that channel. What the report does not surface is that branded paid search is capturing demand that already existed, users who were already sold through earlier touchpoints and simply typed the brand name to find the sign-up page. Meanwhile, the organic content program that introduced those users to the product in the first place, and that is responsible for generating 41% of qualified pipeline at top-quartile SaaS teams, receives no credit and gets defunded in the next budget cycle. The budget reallocation error is not a strategic failure; it is a measurement failure. The team optimized what their attribution model could see, not what was actually driving growth.
Privacy changes, ad blockers, and cross-device behavior have made clean user-level tracking significantly harder in 2026, amplifying this problem across the industry. As conversion funnel analysis frameworks for 2026 make clear, teams that optimize what their dashboard captures rather than what buyers experience will consistently draw wrong conclusions about where optimization effort belongs.
The Dashboard Requirement for Accurate Diagnosis
Solving this requires a specific kind of visibility: a dashboard that surfaces stage-by-stage conversion rates alongside channel-level attribution in the same view. Without that unified perspective, teams are forced to reconcile data from separate analytics tools, CRM reports, and spreadsheets, and the reconciliation process introduces both lag and interpretation error.
FunnelKeeper's funnel dashboards are built around this diagnostic workflow precisely. Rather than requiring teams to manually join funnel performance data with channel attribution across multiple tools, the platform connects stage conversion rates to marketing channel performance in a single view. This means a growth team can identify not just where the funnel drops but which traffic sources are responsible for the drop, enabling prioritization decisions grounded in data rather than gut instinct.
The Three-Step Diagnostic Sequence
The practical application of this framework follows a clear sequence. First, benchmark your actual stage-by-stage conversion rates against top-quartile standards using the seven-stage table from the previous section. Second, identify the stage where your rate shows the largest gap relative to top-quartile performance; that gap, not the stage with the highest absolute volume, is your highest-leverage optimization target. Third, layer in attribution data to determine the root cause: is the underperformance driven by traffic quality, messaging misalignment, product friction during trial, or a breakdown in the sales handoff process?
Each root cause requires a different intervention. Traffic quality problems point to channel or audience targeting. Messaging problems point to positioning and copy on landing pages. Product friction points to onboarding and activation flows. Sales process breakdowns point to SDR sequencing, qualification criteria, and the MQL-to-SQL handoff. Without the diagnostic sequence, teams conflate these causes and apply the wrong fix, at real cost.
Stage-by-Stage Optimization Playbook
Acquisition Layer: Channel Mix Is Already CRO
Before a single visitor reaches your landing page, your channel selection has already determined the conversion ceiling for that cohort. Organic search closes at approximately 14.6%, paid search at 5.1%, paid social at 0.9%, and display at a marginal 0.3%. Those figures mean a team investing heavily in display advertising is starting every conversion conversation with a 98-times disadvantage relative to organic. Channel mix is not a media planning decision sitting outside CRO; it is conversion rate optimization at the acquisition layer. Top-quartile SaaS teams have internalized this: content and organic now drive 41% of qualified pipeline among top performers, while paid acquisition's share has fallen from 34% to 26% since 2023. Reallocating budget toward channels that arrive with higher purchase intent is often the highest-leverage conversion move available, and it requires no on-site changes at all.
AI Search Is Rewriting the Top-of-Funnel Rules
The organic channel itself is being structurally disrupted in 2026. Google AI Overviews now appear in approximately 13% of all queries, suppressing position-one organic CTRs by roughly 18%. Teams that built acquisition models around ranking first are seeing traffic erode without any change in their ranking. The corrective is not to abandon SEO but to expand the optimization surface to include answer engine optimization (AEO), structuring content so it appears within AI-generated responses rather than only in traditional blue-link results.
The more striking data point involves generative AI referral traffic. A 94-site analysis found ChatGPT-referred visitors converting at 15.9% compared to Google organic at 1.76%, representing a conversion rate roughly nine times higher. According to B2B SaaS conversion benchmarks by customer journey stage, this gap reflects the higher-intent nature of users arriving from conversational AI queries; they have typically already evaluated options before clicking through. Treating ChatGPT as a referral channel to actively cultivate, through structured content, authoritative sourcing, and product mention strategies, is a legitimate top-of-funnel conversion lever in 2026.
Mid-Funnel Segmentation: Stop Serving One Message to Everyone
The most common mid-funnel conversion failure is architectural. A first-time visitor who landed on a blog post and a returning buyer who has visited the pricing page three times are not the same cohort, yet most SaaS sites serve them identical CTAs, identical copy, and identical social proof. Intent signals including page depth, feature page engagement, return visit frequency, and time-on-site distinguish casual browsers from purchase-ready buyers. Segmenting these cohorts and routing them to differentiated experiences, whether that means a product tour for early-stage visitors or a "talk to sales" path for high-intent returners, consistently recovers conversion that undifferentiated funnels leave behind.
The data on conversion path selection reinforces this. Book Demo paths convert MQLs at roughly 6%, while self-serve product-qualified paths convert at 20 to 30%. That gap is not simply a product quality difference; it reflects a mismatch between buyer readiness and the conversion path offered. Instrumenting intent signals in your analytics stack and using them to trigger differentiated CTAs is the mechanical implementation of this principle.
Trial Structure and Pricing Transparency as Hard Levers
Pricing and trial decisions are among the most measurable optimization levers available, and they are frequently under-tested. Opt-out free trials requiring a credit card convert at 48.8% versus 18.2% for opt-in trials, a difference large enough to alter unit economics at scale. The Product-Led Growth 2026 PLG Strategy Playbook confirms that shorter trials with proactive activation touchpoints consistently outperform long open-ended trials, particularly for self-serve products where user motivation decays quickly without structured prompts. Every 10-minute delay in reaching time-to-value reduces trial conversion by 8% for complex products such as developer tools, API platforms, and integration suites.
PLG vs. Sales-Led: Separate Optimization Priorities
Applying the same optimization playbook to PLG and sales-led motions is a category error. PLG teams should optimize relentlessly for onboarding completion and first "aha moment" timing; only 34% of PLG companies currently track activation, despite it being the single metric most predictive of free-to-paid conversion. Best-in-class activation rates exceed 70%, while the median sits between 20 and 40%. Sales-led teams face a different bottleneck: the MQL-to-SQL handoff and speed-to-first-meeting. MQL-to-SQL rates at the top quartile reach 55 to 70%, compared to a 13 to 20% average for SMB teams, a gap driven primarily by lead scoring precision and response time. The SaaS marketing GTM playbook for 2026 notes that hybrid PLG-plus-sales is now the dominant model above $5M ARR, which means most teams need both optimization tracks running in parallel.
Expansion and AI-Assisted GTM as Late-Funnel Multipliers
At mature SaaS companies, expansion revenue accounts for 60 to 80% of growth, yet most teams still treat it as a renewal-cycle event rather than a continuously optimized conversion surface. In usage-based models, product usage milestones are the conversion events. Instrumenting these triggers, and automating expansion conversations at the moment a user crosses a meaningful usage threshold, consistently outperforms teams that wait for renewal conversations. PQL frameworks produce roughly 3x higher conversion than traditional MQL funnels, yet only 25% of PLG companies have adopted them as of 2026.
Layering AI-assisted workflows across this full funnel stack is now producing measurable CAC payback improvements. Automating lead scoring, personalizing nurture sequences, and surfacing PQL signals earlier in the trial window are shortening CAC payback periods by 3 to 5 months, according to ICONIQ and the Subscribed Institute's 2026 data. Given that median CAC payback has stretched to 12 to 18 months for mid-market SaaS companies, a 3 to 5 month reduction represents a material improvement in capital efficiency and a direct path to healthier LTV:CAC ratios.
Conversion Optimization for Bootstrapped and Vibe-Coded Apps
The benchmarks discussed throughout this post carry an important caveat: virtually all of them were built from data collected at funded B2B companies with dedicated sales development representatives, marketing operations teams, and multi-touch attribution infrastructure. Applying a 13–20% MQL-to-SQL target to a bootstrapped app with no SDR motion is not just unhelpful; it is a category error that redirects optimization effort toward a funnel stage that simply does not exist in your operation. According to 2026 data on high-converting SaaS funnel construction, 68% of B2B SaaS companies already lack a documented funnel optimization strategy, and that gap is significantly more acute for solo founders consuming enterprise-grade frameworks that were never designed for their context.
The Compressed Funnel That Actually Applies
For bootstrapped and vibe-coded apps, the seven-stage funnel model collapses to three stages that matter: visitor-to-signup, signup-to-activation, and activation-to-paid. Within that compressed structure, the highest-leverage optimization is almost never acquisition. It is activation. Traffic volumes are smaller, there is no sales team to rescue stalled trials, and every signup that fails to reach the activation threshold is a permanent loss. McKinsey data cited in current SaaS funnel research indicates that systematic funnel optimization produces 30–50% conversion rate improvements, but for lean teams, that gain compounds fastest when applied to the activation stage rather than the top of funnel. Vibe-coded apps, built rapidly with AI coding tools, face a specific activation risk: inconsistent onboarding flows and underdeveloped in-app guidance are common byproducts of fast-shipped products, creating friction at precisely the moment a new user is deciding whether your product is worth their continued attention.
Activation Signals as Your Only Conversion Lever
Without an SDR to follow up on stalled trials, in-product behavior becomes the entire conversion mechanism. Three metrics function as leading indicators of paid conversion for product-led apps: onboarding completion rate, time-to-first-value, and usage frequency within the first seven days. A practical decision rule worth applying: if fewer than 40% of signups complete your product's core action within seven days, fixing activation deserves priority over any additional acquisition spend. Channel diversification and creative testing are valid later-stage moves; they are premature when the funnel is losing users before they ever understand the product's value.
Attribution Without the Enterprise Stack
Attribution clarity does not require a data warehouse or a dedicated analytics engineer. A consistent UTM taxonomy covering source, medium, and campaign, paired with a funnel dashboard that surfaces signup-to-paid conversion by source, is sufficient to answer the question that actually matters for a bootstrapped founder: which channels are producing users who activate and pay, versus which channels are generating signups that disappear. As noted in B2B SaaS funnel conversion benchmarks for 2026, channel quality has become the primary variable as acquisition costs continue rising. FunnelKeeper is purpose-built for exactly this operational context. Founders can instrument their funnel, connect acquisition source data, and surface activation-to-paid conversion metrics without a full marketing operations stack, making the kind of channel-quality analysis that previously required an analytics team accessible at the earliest stages of growth.
The 2026 Conversion Levers Your Competitors Are Not Using Yet
The five levers below are not theoretical. They are already being operationalized by the teams pulling away from the pack, and the gap between early adopters and late movers is widening with each quarter.
AI-Driven Hyper-Personalization on Pricing Pages and CTAs
Static pricing pages and generic CTAs are leaving measurable revenue on the table. In 2026, teams with well-instrumented funnels are deploying dynamic content layers that adapt messaging, social proof, and feature emphasis based on visitor segment, industry vertical, or prior engagement history. The prerequisite for making this work is solid funnel instrumentation: a clean event taxonomy, reliable identity resolution across sessions, and a data layer that can pass visitor context to the personalization engine in real time. Without that foundation, personalization degrades to noise. With it, one SaaS growth team using behavioral clustering and predictive scoring reported trial signups climbing 22% in six weeks by focusing test traffic exclusively on high-probability converters, a meaningful lift given that most sites have hovered below 3% conversion for nearly a decade despite rising acquisition costs.
Video-First CRO Inside the Trial Experience
The common mistake teams make with video is burying it on a marketing landing page as an awareness asset. The emerging 2026 practice is different: short product demonstration videos surfaced inside the trial experience at the precise activation moment where users typically stall. The strategic logic is reducing time-to-value, not time-to-click. When a user who signed up for a free trial hits a feature they do not immediately understand, a contextual 60-to-90-second demonstration video delivered at that friction point converts at a meaningfully higher rate than a support article or tooltip. Given that the self-serve trial-to-paid average sits at just 4.6% compared to 17.4% for sales-assisted PQL motions, in-product video is one of the few scalable ways to close that gap without adding headcount.
Generative Engine Optimization as a Conversion Channel
GEO has crossed from experimental to investable. ChatGPT referral traffic converts 31% higher than non-branded organic search, and one documented case recorded a 15.9% conversion rate from ChatGPT referrals against 1.76% from Google organic on the same destination. The mechanism is straightforward: a visitor arriving via an AI citation has already received a pre-qualified answer and carries substantially higher purchase intent before reaching your site. Building for AI citation requires a specific content architecture: authoritative long-form answers to specific evaluation-stage questions, structured data markup, and content that reads as a citable source rather than a conversion-optimized landing page. Teams that instrument this channel now are acquiring high-intent pipeline before those buyers ever initiate a traditional search.
The Organic Pipeline Shift and Its CRO Implications
Top-quartile SaaS teams now source 41% of qualified pipeline from content and organic channels, while paid acquisition's share of pipeline fell from 34% to 26% between 2023 and 2026. This shift has a direct implication for where CRO effort should be allocated: as more pipeline enters through content, optimizing the content-to-conversion path becomes higher leverage than refining paid landing pages. That means tightening the journey from a blog post to a product page, reducing friction on mid-funnel content upgrades, and ensuring that organic traffic lands in experiences calibrated to the query intent that generated the click.
Session-Level Intent Segmentation
Treating a first-time researcher and a returning buyer identically on the same pricing page is a recognized CRO failure mode, yet most teams have not operationalized the fix. Real-time visitor intent scoring tools can classify session behavior using signals including page sequence, scroll depth, return visit flags, and query string parameters to distinguish research-mode visitors from evaluation-mode visitors before any form submission occurs. Teams that instrument this segmentation first can route high-intent sessions to accelerated paths, such as direct calendar booking or personalized demo offers, while serving research-mode visitors educational content that nurtures rather than pressures. The competitive edge here is narrow but real: it exists only until the tactic becomes standard practice.
What a Conversion-Optimized Dashboard Actually Looks Like
Most marketing dashboards are built to answer one question: what happened last month? That orientation produces reports filled with impression counts, MQL volume totals, and click-through rates that look comprehensive but leave the team no closer to understanding why trial-to-paid conversion dropped three points in Q2. The critical distinction between a reporting dashboard and a diagnostic dashboard is not the volume of data displayed; it is whether the first metric a user sees is tied to an actionable next step or is simply a historical number sitting on a screen.
The Conversion-First Architecture
A conversion-optimized dashboard is structured around stage-by-stage funnel conversion rates as its primary view, with channel-level attribution sitting directly underneath as the first drill-down layer. This architecture means a team opens the dashboard on Monday morning and immediately sees both where conversion is breaking down and which acquisition channels are responsible, without toggling between four separate tools to reconstruct the picture. For example, clicking into MQL-to-SQL rate should instantly surface that metric segmented by organic search, paid search, and outbound, rather than requiring a manual export and pivot table. The UX principle here is that the gap and its most likely cause should always appear together in a single view.
The Six Metrics That Belong on the First Screen
The metrics in the primary view should map directly to the funnel diagnostic sequence, in this specific order:
Visitor-to-lead rate by channel surfaces attribution at the entry point, where average B2B SaaS performance sits at 1.5 to 2.5% and top performers reach 8 to 15%
Lead-to-MQL rate signals top-of-funnel quality, with top-quartile teams achieving 45 to 60% versus the 36% average
MQL-to-SQL rate reveals sales-marketing handoff health, where top performers reach 55 to 70% compared to an SMB average of 13 to 20%
Trial-to-paid rate by motion must be split between self-serve (average 4.6%) and PQL (average 17.4%), because blending the two into a single number obscures which motion is underperforming
CAC payback period by channel provides the efficiency benchmark, particularly critical given that median payback has stretched to 18 months for mid-market SaaS companies in 2026
LTV:CAC closes the diagnostic loop by confirming whether improved conversion is producing durable unit economics
Each metric in this sequence feeds the next diagnostic question. If visitor-to-lead rate looks healthy but lead-to-MQL rate is weak, the problem is lead quality, not traffic volume. If MQL-to-SQL is strong but trial-to-paid is low, the issue is in the product experience or onboarding, not in marketing handoff.
What Belongs Off the First Screen
Research shows that marketers currently track an average of 20-plus KPIs, yet dashboards focused on just 5 to 7 metrics consistently outperform those tracking 20 or more. The metrics that degrade diagnostic clarity and should be demoted to secondary views include impression counts, MQL volume without downstream stage tracking, click-through rates reported in isolation, and any metric that cannot be traced to a pipeline or ARR outcome. MQL volume is a particularly common offender: a team celebrating rising MQL numbers while MQL-to-SQL rate quietly declines is measuring activity, not progress.
Configuring for Diagnosis, Not Reporting
FunnelKeeper's dashboard builder is structured around this conversion-first hierarchy from the ground up. Teams can configure views that surface their actual stage-conversion gaps alongside the channel attribution data needed to act on them, rather than spending the first two hours of every Monday reconstructing the same analysis from raw exports. Proper attribution dashboards have been shown to cut CAC by 20 to 40% precisely because they compress the time between identifying a conversion gap and making the resource decision that closes it. The goal is a single configured view that makes the next action obvious, not a flexible reporting tool that requires a data analyst to interpret before it becomes useful.
Start With the Stage That Leaks the Most
The gap between average SaaS teams converting 1.5–2.5% of visitors into leads and top performers reaching 8–15% is not a traffic volume problem. It is a visibility and prioritization problem. Teams stuck at the low end are not failing to attract visitors; they are failing to diagnose which stage is consuming the most revenue before it reaches the pipeline.
The single most actionable step from everything covered in this framework: benchmark your current stage-by-stage rates against the seven-stage table, identify the stage with the largest gap to top-quartile performance, and layer in attribution data before committing budget to any fix. Without attribution context, teams routinely optimize the wrong stage, pouring resources into MQL-to-SQL conversion when the actual leak is at lead-to-MQL, or investing in paid acquisition when organic is already converting at nearly three times the rate.
Teams that connect funnel diagnostics to attribution consistently stop wasting cycles on isolated experiments that produce marginal lift. That reorientation, from running disconnected A/B tests toward fixing the single highest-leverage stage first, produces compounding ARR impact that no individual headline test can replicate.
FunnelKeeper provides exactly this diagnostic workflow: a funnel dashboard paired with attribution visibility that surfaces your leaking stage without requiring a dedicated analytics team. Start with your funnel, identify your leak, and fix the right thing first.